Dominate Your Video Ads with These Key Benchmarks This listicle provides 10 essential video ad benchmarks to measure and optimize your video campaigns in 2025. Understanding these metrics is crucial for maximizing ROI across platforms like YouTube, Facebook, TikTok, and CTV. From click-through rate (CTR) to video completion rate (VCR), we'll cover the KPIs that […]
Dominate Your Video Ads with These Key Benchmarks
This listicle provides 10 essential video ad benchmarks to measure and optimize your video campaigns in 2025. Understanding these metrics is crucial for maximizing ROI across platforms like YouTube, Facebook, TikTok, and CTV. From click-through rate (CTR) to video completion rate (VCR), we'll cover the KPIs that matter most for e-commerce, fashion, tech, beauty, agencies, SaaS, and UGC brands. Use these video ad benchmarks to assess performance and improve your results.
1. View-Through Rate (VTR)
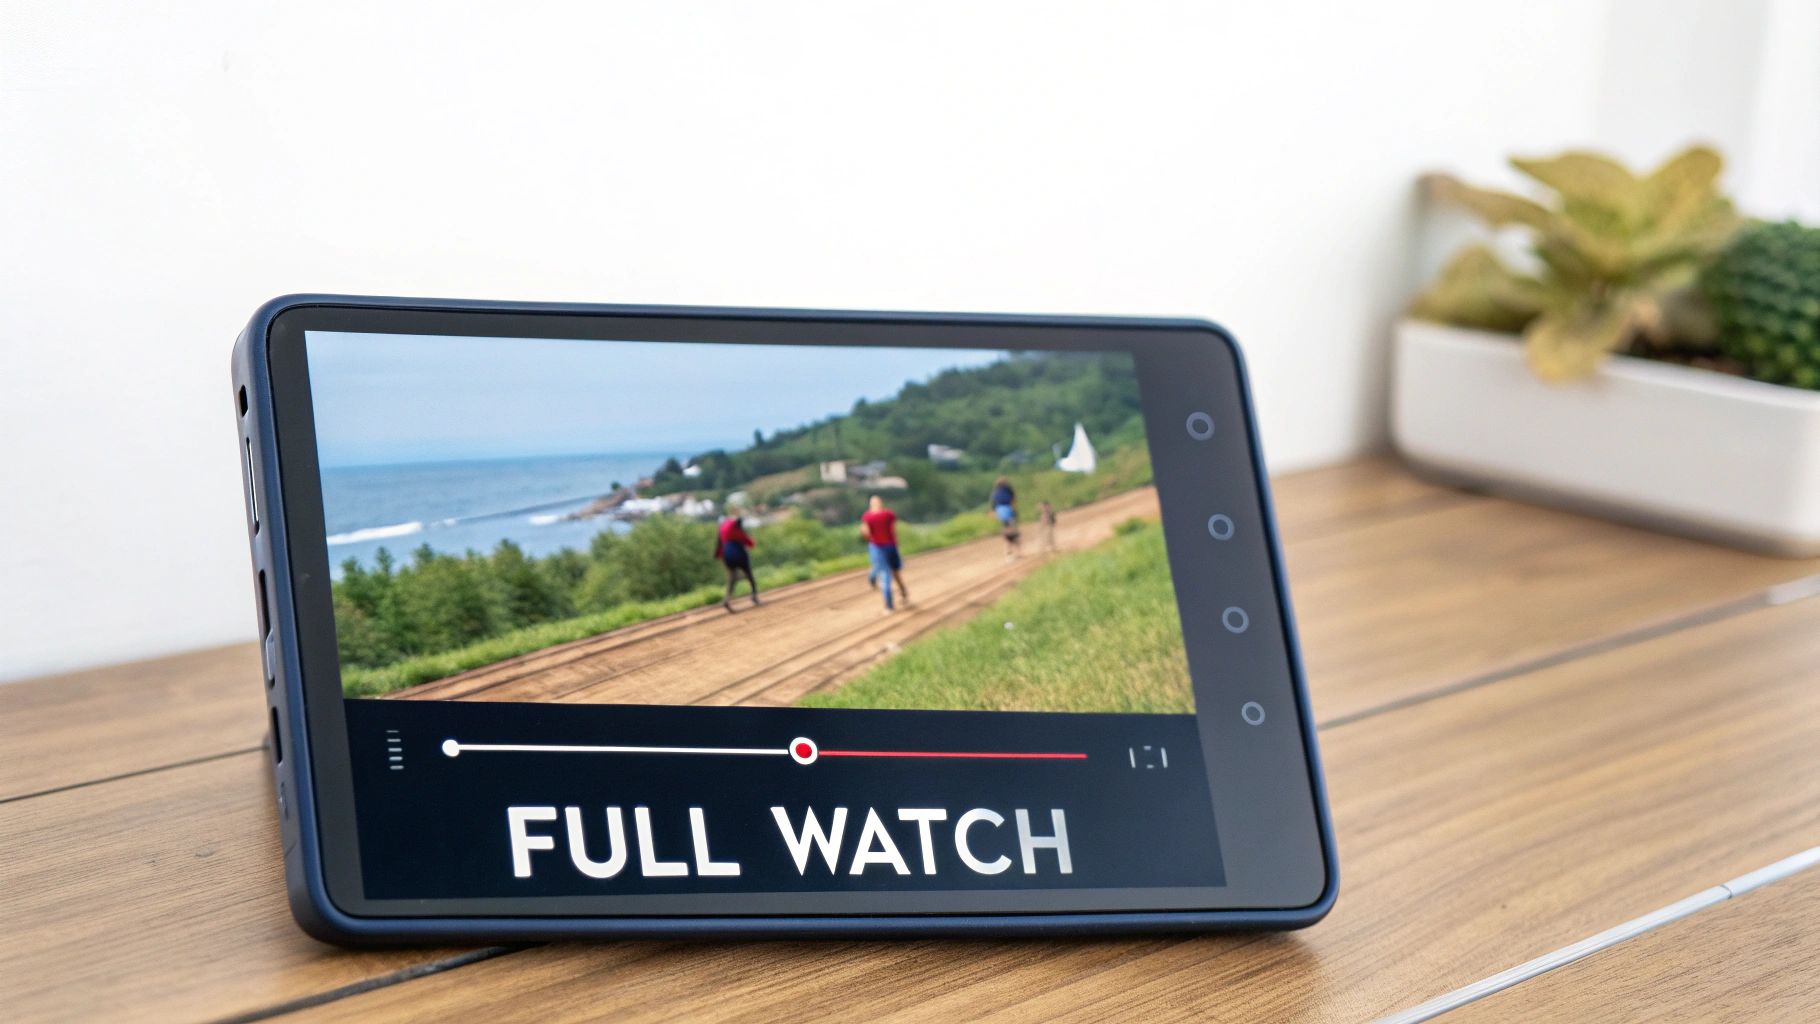
View-Through Rate (VTR) is a fundamental video ad benchmark that measures the percentage of viewers who watch a video ad to its completion. This metric provides valuable insights into audience engagement and the relevance of your video content. A high VTR suggests viewers find your ad compelling enough to watch from beginning to end, a critical factor, especially for campaigns focused on brand storytelling and detailed product explanations. Understanding and optimizing your VTR is essential for maximizing the impact of your video advertising strategy across various platforms.
VTR's prominence as a video ad benchmark stems from its direct correlation with audience engagement. It helps assess the effectiveness of your ad creative and provides a clear measure of how well your content resonates with your target audience. This is particularly useful for e-commerce businesses, apparel and fashion brands, tech and gadget startups, beauty and cosmetics companies, digital marketing agencies, SaaS companies, and those leveraging user-generated content (UGC), where capturing and maintaining audience attention is paramount.
Features and Benefits:
Measures complete video views: Provides a quantifiable measure of how many viewers watched your video to the end.
Indicates content engagement quality: A high VTR signals strong audience interest and content relevance.
Helps evaluate ad creative effectiveness: Allows you to assess the impact of different creative elements on viewer engagement.
Industry standard for video completion: Provides a benchmark for comparing your performance against competitors and industry averages.
Pros:
Direct indicator of content engagement: Offers a clear picture of audience interest in your video content.
Helps identify which video content resonates best: Enables data-driven decisions about future video content creation.
Useful for comparing performance across different video lengths: Allows you to optimize video length for maximum viewer engagement.
Cons:
Doesn't account for partial viewing value: A viewer who watches 90% of a video might still be influenced, even without completing it.
Can be inflated by shorter videos: Shorter videos naturally have higher completion rates, which can skew comparisons with longer-form content.
Doesn't measure actual impact on brand recall or purchase intent: While high VTR suggests engagement, it doesn't directly measure the impact on conversions or brand awareness.
Examples of Successful Implementation and Benchmarks:
Google/YouTube: Reports an average YouTube VTR of 31.9% across all industries, providing a useful baseline for comparison.
Facebook: Video ads on Facebook platforms typically average a 16-17% VTR, indicating the platform-specific dynamics of video engagement.
TikTok: The immersive, short-form video format on TikTok often generates significantly higher VTRs, sometimes exceeding 80%, demonstrating the impact of platform and content format.
Actionable Tips for Optimizing VTR:
Keep videos concise: Aim for videos under 30 seconds to encourage higher completion rates. For complex products or SaaS offerings, consider a series of shorter videos rather than one long one.
Front-load key messages: Place the most important information within the first 5 seconds to capture viewer attention and communicate value quickly.
Test different video lengths: Experiment with various durations to determine the optimal length for your specific audience and platform. A/B testing can be invaluable here.
Employ storytelling techniques: Craft narratives that build suspense and encourage viewers to watch until the end to discover the resolution. This is particularly effective for fashion brands, beauty companies, and those utilizing UGC.
Optimize for mobile viewing: Ensure videos are easily viewable on mobile devices, as a large portion of video consumption happens on smartphones. Consider vertical video formats for platforms like TikTok and Instagram Stories.
When and Why to Use VTR:
VTR is a valuable metric for any business utilizing video advertising. It's particularly relevant when:
Launching new video ad campaigns: Track VTR to gauge initial audience reception and identify areas for improvement.
Testing different creative approaches: Compare VTR across different video variations to identify which creative elements resonate most effectively.
Optimizing video content for different platforms: Use VTR to tailor video length and content to the specific audience and format of each platform.
Assessing the overall effectiveness of your video marketing strategy: Monitor VTR trends over time to track the performance of your video content and identify opportunities for optimization.
By understanding and optimizing your VTR, you can significantly improve the performance of your video ad campaigns and ensure your message resonates with your target audience. This is a crucial benchmark for anyone investing in video marketing, from small e-commerce businesses to large SaaS corporations.
2. Click-Through Rate (CTR)
Click-Through Rate (CTR) is a crucial video ad benchmark that measures the percentage of viewers who click on your ad after viewing it. This metric goes beyond simply counting views and provides valuable insight into how effectively your video ad drives actionable engagement. CTR essentially bridges the gap between generating awareness and fostering consideration in the marketing funnel. It signifies that a viewer found your ad compelling enough not just to watch, but to take the next step, whether that’s visiting your website, exploring a product page, or signing up for a newsletter. For businesses focused on driving immediate actions, CTR is a cornerstone of performance evaluation.
This metric deserves a prominent place in any video ad benchmark list due to its direct correlation with viewer intent and its comparability across various platforms. Its features include measuring audience action after viewing, indicating the effectiveness of the ad's call-to-action (CTA), and serving as a key performance indicator (KPI) for direct response campaigns. The CTR can vary significantly by platform and ad placement, providing nuances in performance analysis. For example, you might find that your YouTube pre-roll ads have a higher CTR than your Connected TV ads. Learn more about Click-Through Rate (CTR) to understand how to optimize your video creation process for better CTR.
Pros of using CTR as a benchmark:
Direct measure of viewer interest and intent: A high CTR signifies genuine interest in your offering.
Easily comparable across different platforms: Allows for standardized performance evaluation across YouTube, Facebook, Connected TV, and more.
Correlates with campaign ROI for direct response objectives: Directly links ad engagement with tangible business outcomes for e-commerce businesses, SaaS companies, and other direct response-focused entities.
Cons of relying solely on CTR:
Not all valuable engagement results in clicks: Brand awareness campaigns, for instance, might prioritize impressions and viewership over immediate clicks.
Can be influenced by placement rather than content quality: A prominent placement might lead to accidental clicks, inflating the CTR without reflecting genuine interest.
Often lower for branding campaigns versus direct response: This doesn't necessarily indicate poor performance, but rather a different campaign objective.
Examples of CTR Benchmarks:
Average video ad CTR across platforms: 1.84%
YouTube pre-roll ads: 1.5-2% CTR
Connected TV ads: 0.3-0.5% CTR (often lower CTR but higher engagement quality)
Actionable Tips to Improve CTR:
Include clear, compelling calls-to-action: Tell viewers exactly what you want them to do (e.g., "Shop Now," "Learn More," "Get a Free Quote").
Test different CTA placements within the video: Experiment with pre-roll, mid-roll, and end-screen CTAs to find the most effective placement.
Optimize thumbnail images for higher initial engagement: A captivating thumbnail can significantly increase click-through rates by grabbing viewers' attention.
Consider interactive video formats to increase click opportunities: Interactive elements like clickable buttons, polls, and quizzes can boost engagement and CTR.
This metric is particularly beneficial for e-commerce businesses, apparel and fashion brands, tech and gadget startups, beauty and cosmetics companies, digital marketing agencies, SaaS companies, and those leveraging UGC, all of whom often run performance-driven campaigns. By understanding CTR benchmarks and implementing the tips provided, these businesses can significantly improve their video ad performance and achieve a stronger ROI.
3. Cost Per Completed View (CPCV)
Cost Per Completed View (CPCV) is a crucial video ad benchmark, especially for businesses focused on brand building and maximizing message delivery. Unlike metrics like CPM (Cost Per Mille/Thousand impressions), which only measure views initiated, CPCV drills down to the cost of a viewer watching your entire video ad. This provides a more granular understanding of your video ad spend efficiency and its direct correlation with complete message absorption. For e-commerce businesses, apparel brands, tech startups, beauty companies, digital marketing agencies, SaaS providers, and even those leveraging UGC, understanding CPCV is key to optimizing video advertising ROI.
CPCV works by dividing the total cost of your video ad campaign by the number of completed views. This metric is typically reported in cents, providing a precise measure of how much each completed view costs. For example, a CPCV of $0.03 signifies that you're paying three cents for every user who watches your video from start to finish.
This metric deserves a spot on the list of essential video ad benchmarks because it provides a more accurate representation of campaign effectiveness when compared to metrics that don't account for completion rates. While a low CPM might seem attractive, it's meaningless if viewers are abandoning your video after a few seconds. CPCV addresses this by focusing on completed views, ensuring you’re paying for genuine engagement with your message.
Features and Benefits:
Measures Efficiency of Ad Spend for Completed Views: Provides a direct link between budget allocation and guaranteed message delivery.
Accounts for Both Cost and Completion Rate: Offers a more holistic view of video ad performance than impressions alone.
Allows for Cross-Platform Cost Efficiency Comparison: Enables data-driven decisions about platform selection based on CPCV performance.
Pros:
Directly Ties Budget to Guaranteed Message Delivery: You only pay when your message is fully consumed.
More Meaningful than CPM for Video Campaigns: Offers a more accurate assessment of campaign success.
Helps Optimize Creative Decisions Based on Cost Efficiency: Provides insights into which creative approaches drive higher completion rates and lower CPCVs.
Cons:
Doesn't Measure Quality of Engagement or Impact: While it tracks completions, it doesn't measure actions taken after viewing.
Can Drive Optimization Toward Shorter, Less Informative Content: Focusing solely on CPCV can incentivize sacrificing valuable content for shorter video lengths.
Higher for Premium Placements and Audiences: Targeting highly sought-after demographics and placements usually comes with a higher CPCV.
Examples:
Average CPCV across platforms ranges from $0.01-$0.03.
YouTube's CPCV typically ranges from $0.02-$0.04.
Premium publishers may command $0.05-$0.10 CPCV.
Actionable Tips for Optimizing CPCV:
Balance Video Length with Completion Rate: Experiment with different video lengths to find the sweet spot that maximizes message delivery without sacrificing completion rates.
Test Different Audience Segments to Find Efficiency Sweet Spots: Certain demographics may be more receptive to your message, leading to higher completion rates and lower CPCVs. For SaaS companies, targeting specific industry professionals might yield better results than a broader audience. Similarly, beauty and cosmetics companies might find success targeting specific age groups or interest-based segments.
Consider Platform-Specific Creative Approaches to Boost Completion Rates: Tailor your video creative to the specific platform and audience to maximize engagement and completion rates. UGC, for example, performs exceptionally well on platforms like TikTok and Instagram.
Monitor CPCV Trends Over Time Rather Than Isolated Metrics: Track CPCV performance consistently to identify trends and optimize your strategy accordingly.
Popularized By:
Tubular Labs
Extreme Reach
IAB (Interactive Advertising Bureau)
By understanding and optimizing for CPCV, businesses across various sectors, from e-commerce to SaaS, can ensure their video ad budgets are being utilized efficiently and driving maximum impact through complete message delivery. This benchmark is invaluable for making informed decisions about creative development, platform selection, and audience targeting, ultimately leading to a stronger ROI for video advertising campaigns.
4. Video Engagement Rate
Video Engagement Rate (VER) is a crucial video ad benchmark for understanding how effectively your content resonates with your target audience. Unlike simpler metrics like view counts or completion rates, VER delves deeper, measuring the active interaction viewers have with your videos. This provides a more holistic view of content performance and helps identify videos that truly connect with your audience. This is why it deserves a prominent place in any list of essential video ad benchmarks. Learn more about Video Engagement Rate
VER typically combines multiple engagement signals, including likes, shares, comments, saves, and other platform-specific actions, and expresses them as a percentage of total views. For example, if a video receives 1000 views and garners 50 likes, 20 shares, and 10 comments, the engagement rate would be calculated as (50+20+10)/1000 = 8%. This comprehensive approach offers a more nuanced perspective on content performance than single-dimension metrics.
How VER Works:
VER works by aggregating different engagement actions and relating them to the overall view count. The specific actions included in the calculation can vary depending on the platform. For instance, "saves" are a key engagement metric on Instagram and TikTok, while "comments" and "likes" hold significant weight on YouTube. Understanding these platform-specific nuances is crucial for accurate analysis.
Features and Benefits:
Combines multiple engagement signals: Provides a more comprehensive view of audience interaction.
Measures active interaction: Focuses on meaningful engagement rather than passive viewing.
Holistic view of content performance: Offers a deeper understanding of content resonance.
Accounts for platform-specific behaviors: Adapts to different engagement patterns across various social media channels.
Pros:
More comprehensive than single-dimension metrics: Paints a fuller picture of video performance.
Strong predictor of brand lift and recall: High engagement often translates to increased brand awareness.
Helps identify truly resonant content worth amplifying: Highlights top-performing videos for further promotion and budget allocation.
Cons:
Calculation methods vary across platforms: Makes direct cross-platform comparison challenging.
Different engagement actions have different value: A "share" arguably holds more weight than a "like," but this isn't always reflected in basic VER calculations.
Difficult to standardize for cross-platform comparison: Lack of a universal standard makes comparing performance across platforms complex.
Examples of Successful Implementation:
Understanding industry benchmarks is crucial for context. For instance, Instagram Reels generally see an average engagement rate of 1.95%, while TikTok boasts a higher average of 5.96%. YouTube brand videos typically fall within the 0.5-1.5% range. These benchmarks can help e-commerce businesses, apparel and fashion brands, tech startups, beauty and cosmetics companies, digital marketing agencies, SaaS companies, and those leveraging user-generated content (UGC) gauge their performance against industry averages.
Actionable Tips for E-commerce, Fashion, Tech, Beauty, Agencies, SaaS, and UGC Creators:
Include elements that drive comments and discussion: Ask questions, run contests, and respond to comments to foster interaction.
Test emotional triggers that inspire sharing: Content evoking emotions like joy, surprise, or inspiration is more likely to be shared.
Analyze which engagement types correlate with business outcomes: Determine which actions (likes, shares, comments) are most valuable for driving conversions and sales.
Optimize for platform-specific engagement actions: Tailor your strategy to each platform's unique engagement features. For example, encourage saves on Instagram and TikTok.
When and Why to Use VER:
VER should be a cornerstone of your video ad analysis. Use it to:
Track content performance: Monitor VER to identify which videos resonate most with your audience.
Inform content strategy: Use insights from VER to create more engaging content in the future.
Optimize ad spend: Allocate budget towards videos with high engagement rates to maximize ROI.
Benchmark against competitors: Compare your VER to industry averages and competitors' performance to identify areas for improvement.
By leveraging Video Engagement Rate as a key benchmark, you can gain a deeper understanding of your audience’s preferences, optimize your video content strategy, and ultimately drive better results from your video ad campaigns.
5. Viewability Rate
Viewability Rate is a crucial video ad benchmark that measures the percentage of ad impressions that are actually viewable by users, according to industry standards. This metric is fundamental for e-commerce businesses, apparel and fashion brands, tech and gadget startups, beauty and cosmetics companies, digital marketing agencies, SaaS providers, and those leveraging user-generated content (UGC), as it ensures that advertising budgets are spent on ads that have a chance to be seen. It deserves a place on this list because it's a foundational element of any successful video advertising campaign. Without a solid understanding of viewability, you’re essentially flying blind in terms of ad performance.
The Media Rating Council (MRC) defines a viewable video ad impression as one where at least 50% of its pixels are visible on screen for a minimum of two consecutive seconds. This standard provides a baseline for measuring whether an ad has the opportunity to be seen. Viewability goes beyond simply counting impressions; it measures ad visibility and provides a more accurate reflection of actual exposure.
How it Works and Why It Matters:
Viewability Rate is a core component of evaluating ad performance. It acts as a prerequisite for all other engagement metrics. Click-through rates, watch time, and conversions are all meaningless if the ad itself wasn't viewable in the first place. By prioritizing viewability, you ensure that your target audience, whether they're browsing for apparel, tech gadgets, beauty products, or SaaS solutions, actually has the opportunity to engage with your message.
Features and Benefits:
Measures Actual Visibility: Focuses on ads actually seen, not just served impressions.
Industry Standard: Provides a common metric for evaluating ad quality across platforms.
Foundation for Engagement: Serves as a baseline for measuring other key performance indicators.
Payment Model Tie-in: Increasingly linked to viewable CPM (vCPM) models, ensuring you only pay for ads that are seen.
Pros:
Ensures Basic Ad Delivery Quality: Confirms ads are being displayed correctly and have the potential to be seen.
Identifies Problematic Placements: Helps pinpoint underperforming ad placements that need optimization.
Cost-Effective Advertising: Viewable impression buying (vCPM) protects ad spend by only paying for viewable ads.
Cons:
Minimum Standard, Not a Guarantee of Engagement: While meeting the MRC standard is essential, it doesn't guarantee meaningful engagement or attention.
Measurement Challenges: Technical limitations can affect accurate measurement across different devices and environments.
Doesn't Measure Attention: Viewability confirms visibility, but not whether the viewer actually paid attention to the ad.
Examples of Successful Implementation:
Google Display Network: Achieves an average viewability rate of 66%.
YouTube In-Stream Ads: Boasts high viewability rates, often between 93-95%.
Mobile Video: Generally outperforms desktop in terms of viewability, with averages around 72% compared to 68% for desktop. This is especially important for brands targeting mobile-first audiences.
Actionable Tips for Improvement:
Prioritize Premium Platforms: Opt for platforms with robust, independently verified viewability reporting.
Strategic Placement: Favor above-the-fold and sticky ad placements to maximize visibility. Consider how users consume content on different platforms and tailor your placements accordingly.
Negotiate Viewability Guarantees: Work with publishers to secure guaranteed viewability thresholds for your campaigns.
Utilize Attention Metrics: Supplement viewability data with attention metrics for a more comprehensive understanding of ad effectiveness. Tools like eye-tracking or time-in-view can provide valuable insights.
Popularized By:
Media Rating Council (MRC)
Integral Ad Science
DoubleVerify
Moat Analytics
By focusing on viewability rate as a key benchmark, businesses across various industries can optimize their video ad campaigns, ensure their ads are seen, and ultimately drive better results. It's a critical step in maximizing the return on your ad spend and achieving your marketing objectives.
6. Video Ad Conversion Rate
Video Ad Conversion Rate is a crucial video ad benchmark for any business investing in video advertising. It measures the percentage of viewers who complete a desired action after watching a video ad. This "action" could be anything from making a purchase on an e-commerce site, signing up for a newsletter, downloading a piece of content, or requesting a demo. This metric directly ties your video advertising efforts to tangible business outcomes, making it one of the most valuable indicators of ROI, particularly for direct response video campaigns. This is why it deserves a prominent place in any list of video ad benchmarks.
This metric is essential because it moves beyond vanity metrics like views and likes, and focuses on actions that directly impact your bottom line. It bridges the gap between awareness (top of the funnel) and action (bottom of the funnel), providing a clear picture of how effectively your videos are driving desired customer behavior.
Features and Benefits:
Measures direct business impact: Unlike metrics like view count, Video Ad Conversion Rate focuses on tangible business outcomes, giving you a clear understanding of how your videos contribute to revenue and growth.
Links awareness to action: It connects the initial awareness generated by your video ads to concrete actions within the marketing funnel, showing how effectively your videos are nurturing potential customers towards conversion.
Customizable based on objectives: The "conversion" can be tailored to align with your specific campaign goals. For an e-commerce brand, it might be a purchase; for a SaaS company, it might be a free trial signup.
Identifies high-value customers: By analyzing which video viewers convert, you can identify segments of your audience that are most likely to become paying customers, enabling you to refine targeting and optimize campaigns for higher value.
Pros:
Direct connection to revenue and business goals: Provides a clear link between video ad spend and revenue generation.
Justifies video ad investment: Offers concrete data to demonstrate the value of video advertising to stakeholders.
Enables optimization towards highest-value customers: Allows you to focus your efforts on the audience segments most likely to convert.
Cons:
Requires proper tracking and attribution setup: Accurate measurement requires careful implementation of tracking mechanisms across platforms.
Video often influences conversions without being the last touch: Attributing conversions solely to video can be challenging, as video often plays a role in a multi-touch customer journey.
Conversion definition varies widely by business model: What constitutes a "conversion" differs significantly across industries and business types, making direct comparisons difficult.
Examples of Successful Implementation & Benchmarks:
E-commerce: E-commerce video ads focusing on product demos and showcasing benefits average a 1.6% conversion rate. A fashion brand using shoppable video ads might track conversions as direct purchases made through the video.
Lead Generation: Lead generation video campaigns, often used by SaaS companies and B2B businesses, typically see conversion rates between 2-5%. A tech startup might measure conversions as demo requests or whitepaper downloads.
Mobile App Installs: Video ads promoting mobile apps generally convert at a lower rate, around 0.77% on average. A mobile gaming company could track conversions as successful app installs directly attributable to their video ads.
Actionable Tips for Optimizing Video Ad Conversion Rate:
Include clear conversion paths (Call to Actions): Make it easy for viewers to take the desired action by incorporating clear and compelling calls to action within or immediately after the video. Use clickable buttons and prominent links.
Retargeting based on video engagement depth: Create retargeting segments based on how viewers interacted with your videos. For example, target viewers who watched 75% of your video with a more product-focused ad promoting a special offer.
Test video lengths: Experiment with different video lengths to see what resonates best with your target audience and drives the highest conversion rates. Shorter videos might work better for impulse purchases, while longer videos could be more effective for complex products or services.
Implement proper attribution modeling: Employing sophisticated attribution models, rather than simply relying on last-click attribution, helps capture the full influence of video across the customer journey.
Popularized By:
Platforms like Google Ads, Facebook Business, TikTok For Business, and Amazon DSP all provide robust tracking and reporting tools to monitor Video Ad Conversion Rates and optimize your video advertising campaigns. They also offer resources and best practices for improving your performance based on this key metric.
7. Cost Per Mille (CPM)
Cost Per Mille (CPM), also known as Cost Per Thousand (M being the Roman numeral for 1,000), is a crucial video ad benchmark representing the cost an advertiser pays for one thousand views or impressions of their video ad. While CPM is a standard metric across all digital advertising, it holds particular importance for video campaigns due to the typically higher production costs associated with creating compelling video content. Understanding CPM is fundamental for effective budget planning, performance evaluation, and cross-platform comparison. This metric deserves its place on this list because it provides a foundational understanding of video advertising costs and serves as a baseline for assessing campaign efficiency.
How CPM Works:
CPM is calculated by dividing the total cost of the ad campaign by the number of impressions (in thousands). For example, if you spend $200 on a campaign that generates 20,000 impressions, your CPM is $10. This simple calculation allows for easy comparison across various platforms, ad placements, and targeting strategies.
Features and Benefits:
Standard Pricing Model: CPM is the most common pricing model for video advertising, making it a universally understood metric across platforms. This allows for straightforward cost comparisons and simplifies budget allocation across different channels.
Basis for Budgeting and Forecasting: CPM data is essential for planning and forecasting advertising budgets. By understanding average CPMs for your target audience and chosen platforms, you can accurately estimate the cost of achieving your desired reach.
Foundation for Complex Metrics: CPM serves as the building block for more sophisticated performance indicators. While CPM itself doesn't measure engagement, it provides context for evaluating metrics like cost per view (CPV) and cost per click (CPC).
Pros:
Universally Understood: CPM is a common language across all digital platforms, facilitating clear communication and comparison.
Straightforward Comparison: CPM allows advertisers to easily compare costs across different platforms, placements, and targeting options.
Simple Calculation: CPM is easy to calculate and track, simplifying campaign monitoring and reporting.
Cons:
Doesn't Reflect Quality: A low CPM doesn't necessarily equate to a successful campaign. CPM alone doesn't account for the quality of impressions or viewer engagement.
No Performance Indication: CPM doesn't measure the effectiveness of the ad in driving conversions or achieving campaign objectives.
Potential for Inefficiency: Focusing solely on minimizing CPM can lead to prioritizing cheap, low-quality impressions over more expensive, but ultimately more effective placements.
Examples of CPM Benchmarks:
YouTube In-Stream: $10-$30 CPM
Facebook/Instagram Feed: $5-$15 CPM
Connected TV (CTV): $25-$65 CPM (reflecting the premium nature of CTV audiences)
Actionable Tips for E-commerce, SaaS, and other Businesses:
Benchmarking: Regularly compare your CPMs against industry and platform averages to identify areas for optimization. Resources like Nielsen, eMarketer, IAB, and Statista provide valuable benchmark data.
Balance with Engagement: Don't solely focus on CPM. Balance CPM efficiency with engagement metrics like view-through rate (VTR) and click-through rate (CTR) to assess true performance.
Targeted Testing: Experiment with different audience targeting parameters to optimize CPM efficiency. Granular targeting can often lead to lower CPMs and higher engagement.
Seasonality Considerations: Be aware of seasonal fluctuations in CPM rates. Demand and competition often increase during peak seasons, impacting advertising costs.
When and Why to Use CPM:
CPM is particularly relevant for brand awareness campaigns where reaching a large audience is the primary objective. For direct response campaigns focused on conversions, consider prioritizing metrics like CPV or CPC. However, even in performance-driven campaigns, understanding CPM is essential for effective budget management and cost optimization. By carefully monitoring CPM and balancing it with engagement metrics, businesses across various sectors, including e-commerce, SaaS, apparel, tech, beauty, and digital marketing agencies, can maximize the return on their video advertising investments.
8. Video Completion Rate (VCR)
Video Completion Rate (VCR) is a crucial video ad benchmark for understanding how effectively your video content captures and retains viewer attention. It measures the percentage of viewers who watch your video ad to its entirety, providing valuable insights into content engagement and overall campaign performance. This metric also typically includes quartile tracking (25%, 50%, 75%, and 100% completion), allowing you to pinpoint precisely where viewers drop off and diagnose potential issues with your creative. Unlike metrics like View-Through Rate (VTR), which can be platform-specific, VCR offers a standardized way to assess video performance across different channels, making it a vital component of any video ad benchmark analysis. This makes VCR highly relevant for businesses across various sectors, from e-commerce and apparel brands to tech startups, beauty companies, digital marketing agencies, SaaS providers, and those leveraging user-generated content (UGC).
VCR deserves its place on this list of video ad benchmarks because it provides a granular view of audience behavior that goes beyond simple views. It directly reflects the relevance of your content and the patience of your audience. By analyzing VCR alongside quartile completion data, you gain a deeper understanding of how viewers interact with your video narrative, identify optimal video lengths, and ultimately improve message delivery effectiveness.
Features and Benefits:
Measures viewer retention: Provides a clear picture of how well your video maintains audience interest throughout its duration.
Tracks quartile completion points: Offers specific insights into viewer drop-off points at 25%, 50%, 75%, and 100% completion.
Indicates content relevance and audience patience: A high VCR suggests that your content resonates with your target audience and effectively holds their attention.
Key indicator for message delivery effectiveness: Helps determine whether your core message is reaching viewers before they disengage.
Pros:
Provides granular view of audience attention span: Allows for in-depth analysis of viewer behavior.
Helps identify optimal video length: Informs decisions about ideal video duration based on audience engagement patterns.
Pinpoints exact moments where viewer interest drops: Enables targeted improvements to specific sections of your video creative.
Standardized across most video platforms: Facilitates cross-platform performance comparisons.
Cons:
Decreases predictably with longer video duration: Longer videos inherently tend to have lower completion rates.
Doesn't account for quality of attention: While VCR measures completion, it doesn't reveal whether viewers were actively engaged or passively watching.
Often platform-dependent (e.g., skippable vs. non-skippable): Skippable ads naturally influence VCR differently than non-skippable formats.
Examples of Successful Implementation and Benchmarks:
15-second ads: Typically achieve 70-75% completion rates.
30-second ads: Generally see around 65% completion rates.
Connected TV (CTV) ads: Often achieve the highest VCR at 95%+ across various durations due to the lean-back viewing experience.
Actionable Tips for Improving VCR:
Front-load key messages: Ensure your core message is delivered within the first 15 seconds to capture attention early.
Analyze drop-off points: Identify areas in your video where viewers lose interest and revise the content accordingly.
Consider platform-specific viewing behaviors: Tailor your video strategy based on the platform's audience and ad formats (e.g., skippable ads on YouTube).
Brand Lift measures the impact of video advertising on key upper-funnel metrics, providing crucial insights into how your video campaigns are influencing brand awareness, perception, and consideration. Unlike vanity metrics like views or clicks, which only tell part of the story, Brand Lift employs controlled experiments to determine the incremental impact of your video ads. This methodology compares metrics between viewers exposed to your ads and a control group who weren't, offering causal evidence of advertising effectiveness and justifying brand-building investments. This makes Brand Lift a critical video ad benchmark, especially for e-commerce businesses, apparel and fashion brands, tech and gadget startups, beauty and cosmetics companies, digital marketing agencies, SaaS companies, and those leveraging user-generated content (UGC). These businesses often rely on building strong brand recognition and positive associations to drive long-term growth.
Brand Lift studies typically span multiple dimensions of brand impact, including:
Brand Awareness: Do more people recognize your brand after seeing your ads?
Favorability: Has viewer perception of your brand improved?
Consideration: Are viewers more likely to consider your brand when making a purchase?
Purchase Intent: Are viewers more likely to express an intention to buy your product or service?
Results are usually reported as a percentage lift above the control group, clearly demonstrating the direct impact of your video campaigns. For example, a 10% lift in brand awareness means that viewers exposed to your ads were 10% more likely to recognize your brand than those who weren't. This provides a quantifiable measure of your video advertising's effectiveness in driving upper-funnel marketing objectives.
Examples of Successful Implementation:
YouTube Brand Lift studies frequently show an average 10% lift in brand awareness, demonstrating the platform's effectiveness for building brand recognition.
Facebook video campaigns often deliver a 14% average lift in purchase intent, highlighting their potential for driving lower-funnel conversions through video.
Connected TV (CTV) campaigns have been shown to yield an 11% average lift in consideration, indicating the growing power of CTV for influencing purchase decisions.
Pros:
Proves Causal Impact: Demonstrates a direct link between video exposure and changes in brand metrics, moving beyond mere correlation.
Justifies Brand-Building Investments: Provides quantifiable evidence of the value of video advertising for upper-funnel marketing objectives.
More Sophisticated than Basic Engagement Metrics: Offers deeper insights than surface-level metrics like views and clicks.
Cons:
Requires Larger Media Investment: Effective Brand Lift studies require sufficient reach to generate statistically significant results.
Results Take Longer to Obtain: Unlike real-time metrics, Brand Lift studies require time to gather and analyze data.
Methodology Varies Across Measurement Partners: Differences in methodologies can make cross-platform comparison challenging.
Tips for Leveraging Brand Lift:
Run Brand Lift studies on campaigns with sufficient scale: Ensure your campaign reaches a large enough audience for reliable results.
Test different creative approaches to identify lift drivers: Experiment with various messaging and visuals to determine what resonates most effectively with your target audience.
Use results to refine targeting and messaging strategy: Leverage Brand Lift insights to optimize your campaigns for maximum impact.
Combine with performance metrics for full-funnel understanding: Integrate Brand Lift data with lower-funnel performance metrics to gain a holistic view of your video advertising effectiveness.
Popularized By: Google Brand Lift, Facebook Brand Lift, Nielsen Digital Brand Effect, Kantar Millward Brown.
By incorporating Brand Lift into your video ad benchmark analysis, you can gain a deeper understanding of your campaigns’ impact on brand perception and move beyond superficial engagement metrics. This allows you to make data-driven decisions to optimize your video advertising strategy and maximize your return on investment.
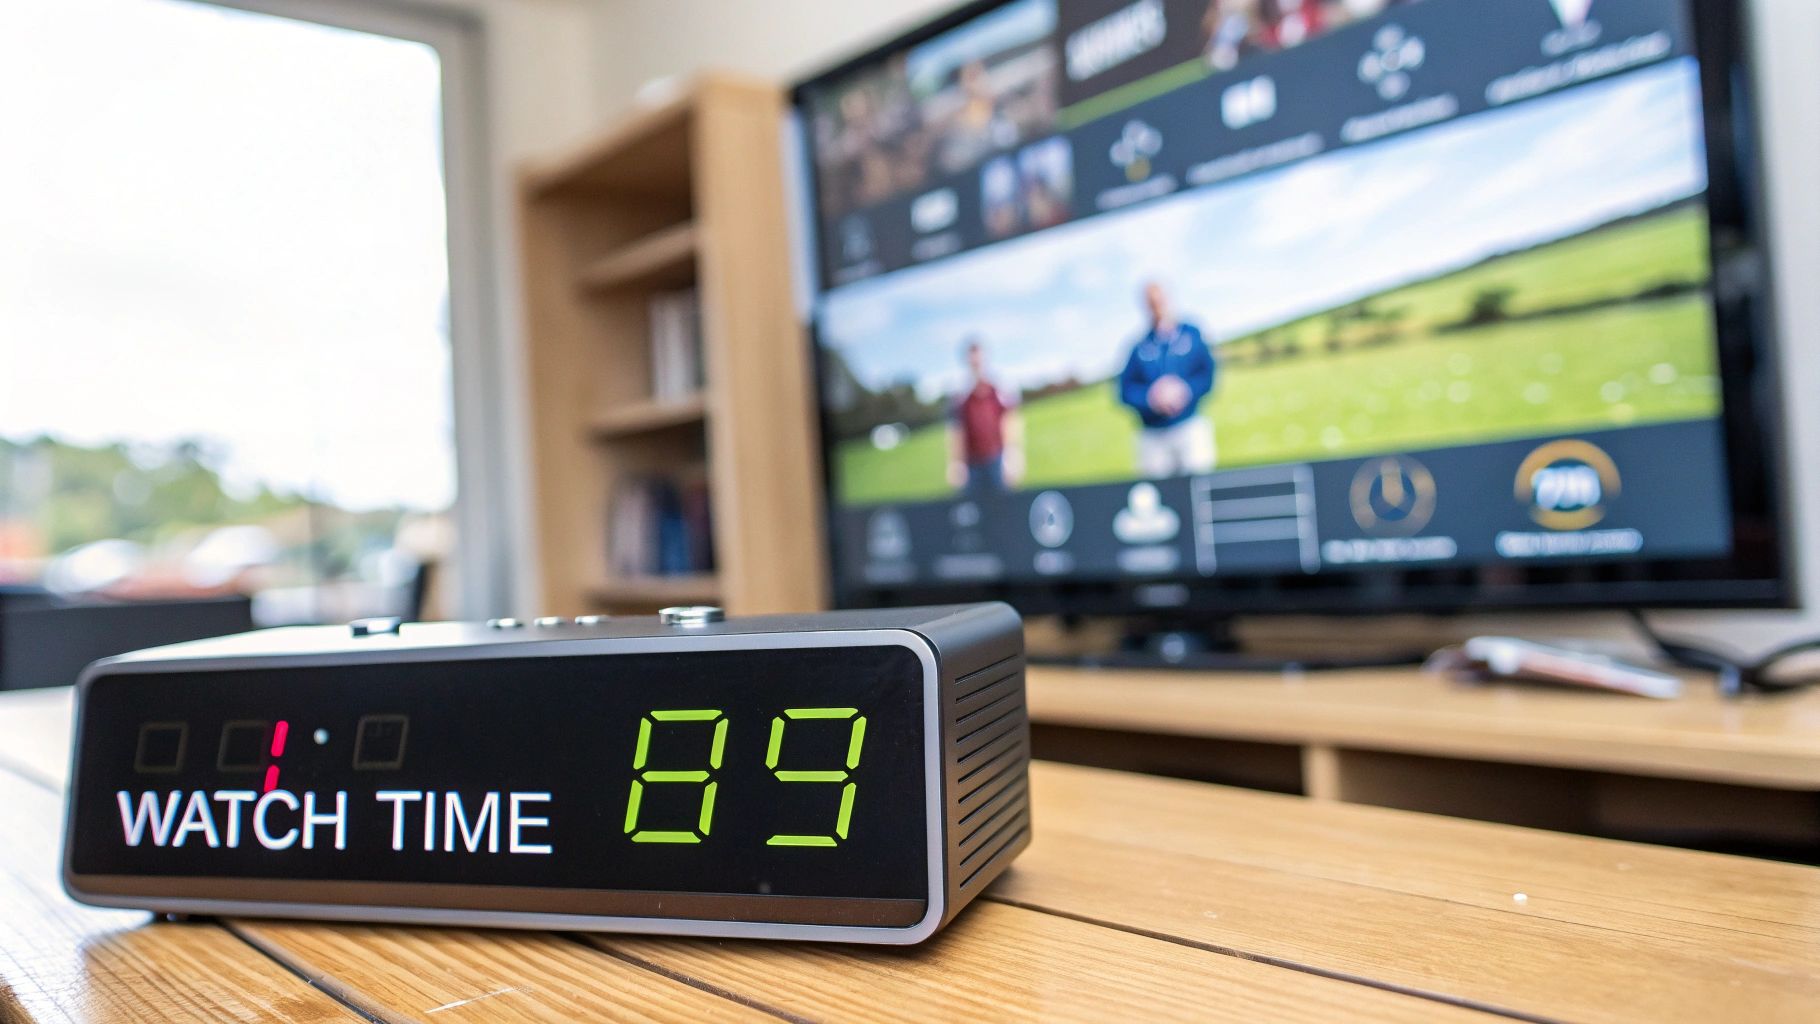
10. Average Watch Time
Average Watch Time is a crucial video ad benchmark that measures the average duration viewers spend actively watching your video ads, typically reported in seconds. Unlike completion rate, which simply tells you whether someone watched the entire video or not, average watch time provides a more granular, continuous metric. This is essential because it works across different video lengths and formats, providing a more accurate picture of audience engagement. In today's digital landscape, where platforms like YouTube, Facebook, and TikTok prioritize time-based engagement in their algorithms, understanding and optimizing for average watch time is paramount for video ad success. This metric deserves its place on this list due to its increasing importance in evaluating ad performance and its ability to reveal valuable insights into audience behavior.
How it Works:
Average watch time is calculated by summing the total watch time of all viewers and dividing it by the total number of views. For instance, if 100 viewers watch a video ad and their combined watch time is 500 seconds, the average watch time is 5 seconds. This metric reveals how effectively your content captures and retains audience attention.
Features and Benefits:
Measures actual seconds of viewing time: Provides a precise measure of engagement, going beyond simple view counts.
Works across different video lengths: Allows for meaningful comparison of performance across various video formats and durations.
Indicates strength of content engagement: A high average watch time suggests compelling content that resonates with the target audience.
Increasingly influential in platform algorithms: Platforms favor content with higher watch times, leading to increased organic reach and visibility.
Strong correlation with brand recall: Longer watch times contribute to improved brand memorability and recognition.
Pros:
More nuanced than binary completion metrics: Offers a deeper understanding of viewer behavior than just knowing if someone watched the entire video.
Helps optimize for maximum audience attention: Pinpoints drop-off points in your videos, enabling data-driven improvements to content and storytelling.
Rewards engaging content regardless of length: A short, captivating video can outperform a longer, less engaging one.
Cons:
Lacks context without video length comparison: Comparing the average watch time of a 15-second ad to a 60-second ad requires considering the relative watch time percentage.
Can be misleading for auto-playing or non-skippable formats: Inflated watch times might occur if viewers are passively exposed to the ad without genuine interest.
No industry standardization in reporting methodology: Discrepancies in how different platforms calculate and report average watch time can make cross-platform comparisons challenging.
Examples of Successful Implementation:
YouTube: While the average watch time across all ads is around 11.7 seconds, highly engaging campaigns can significantly surpass this benchmark.
Instagram: Video ads that capture attention quickly and deliver value within the first few seconds tend to achieve higher average watch times than the platform average of 8.4 seconds.
TikTok: Leveraging TikTok's immersive format and creative tools can result in higher average watch times, exceeding the platform average of around 9.5 seconds.
Actionable Tips for E-commerce, Apparel, Tech, Beauty, Agencies, SaaS, and UGC Creators:
Create 'hook points' every 3-5 seconds: Maintain viewer interest with compelling visuals, sound design, and storytelling elements.
Test different storytelling approaches: Experiment with various narratives, pacing, and calls to action to identify what resonates best with your target audience.
Analyze second-by-second retention: Identify patterns in viewer drop-off to pinpoint areas for improvement in your video content.
Compare watch time as percentage of total length: Contextualize watch time data by calculating the percentage of the total video length that viewers watch on average. This is especially useful for comparing videos of different lengths.
When and Why to Use This Approach:
Average watch time is a critical metric for any business or creator utilizing video advertising. It's particularly relevant for:
Optimizing ad campaigns: Track average watch time to assess the effectiveness of different creative variations and targeting strategies.
Improving content engagement: Use watch time data to identify areas where viewers lose interest and refine your content accordingly.
Understanding audience behavior: Gain insights into how your target audience interacts with your video content and tailor future campaigns to their preferences.
Popularized By: YouTube Analytics, Facebook Ads Manager, TikTok Ads, Wistia. These platforms provide detailed watch time data and analytics to help advertisers optimize their video campaigns.
10-Point Video Ad Benchmark Comparison
Benchmark
Implementation Complexity 🔄
Resource Requirements ⚡
Expected Outcomes 📊
Ideal Use Cases 💡
Key Advantages ⭐
View-Through Rate (VTR)
Moderate – Requires video analytics and tracking tools
Medium – Needs platform-specific tracking
Clear insight on audience engagement via completions
Brand storytelling and video campaign optimization
Direct measure of content engagement
Click-Through Rate (CTR)
Low – Easily integrated via tracking pixels
Low – Standard click-tracking systems
Immediate feedback on viewer action
Direct response campaigns and lead-generation
Quick indicator of viewer intent
Cost Per Completed View (CPCV)
Moderate – Involves budget integration with view tracking
Medium – Requires ad spend and cost data
Optimized ad spend tied to complete view delivery
Campaigns focused on cost efficiency and complete message delivery
Links cost directly to message delivery efficiency
Video Engagement Rate
Moderate – Aggregates multiple engagement signals
High – Needs advanced, multi-signal analytics
Holistic insights into active viewer interaction
Performance analysis where engagement depth matters
Comprehensive measure beyond basic views
Viewability Rate
Moderate – Requires integration with industry guidelines
Medium – Uses verified viewability tools
Assurance of ad visibility and quality impression
Inventory quality assurance and media validation
Ensures ads are viewable based on industry standards
Video Ad Conversion Rate
High – Integrates advanced tracking and attribution systems
High – Demands conversion tracking and CRM tools
Direct connection between video and business outcomes
Direct response and e-commerce campaigns
Demonstrates clear link between ad exposure and conversions
Cost Per Mille (CPM)
Low – Simple calculation based on impressions
Low – Basic budget and impression-tracking
Standard efficiency measure for ad spend
Budget planning, cost forecasting, and basic comparison
Universally recognized pricing model
Video Completion Rate (VCR)
Moderate – Requires precise quartile tracking and analytics
Medium – Advanced video analytics are needed
Detailed insights on audience retention and drop-off
Creative optimization and timing in video content
Granular view of where viewers drop off
Brand Lift
High – Involves experimental design and controlled study setups
High – Needs extensive research and survey tools
Causal impact measurement on brand awareness and favorability
Upper-funnel brand campaigns with a focus on long-term impact
Provides causal evidence linking ad exposure to brand perception
Average Watch Time
Low – Simple metric collection based on viewing duration
Low – Time-based analytics integration
Nuanced measure of overall audience attention
Content strategy enhancement and algorithmic optimization
Continuous measure reflecting attention quality
Elevate Your Video Ad Strategy with CheapAds.ai
Understanding video ad benchmarks is paramount to success in today's digital advertising landscape. From View-Through Rate (VTR) and Click-Through Rate (CTR) to metrics like Cost Per Completed View (CPCV) and Video Completion Rate (VCR), tracking and analyzing these key performance indicators (KPIs) provides invaluable insights into campaign effectiveness. By monitoring metrics such as engagement rate, viewability, and even brand lift, you can fine-tune your targeting, creative, and overall strategy to achieve optimal results. Mastering these video ad benchmarks empowers data-driven decisions, enabling you to maximize your return on investment and achieve your advertising goals.
The most important takeaway is that data-driven optimization, fueled by a deep understanding of these video ad benchmarks, is the key to unlocking truly effective video advertising. By analyzing your performance against these benchmarks, you can identify areas for improvement, refine your targeting, and ultimately drive more conversions and achieve a greater impact. This knowledge empowers you to allocate your budget effectively and maximize your ROI.
However, even with a strong grasp of video ad benchmarks, creating high-quality video content can be a significant hurdle. This is where CheapAds.ai steps in. CheapAds.ai leverages the power of artificial intelligence to generate affordable, engaging video ads that rival traditionally produced content, making hitting those video ad benchmarks easier than ever. Ready to create compelling video ads that perform? Visit CheapAds.ai today and leverage the power of AI to generate cost-effective, high-performing video ads that will help you surpass your video ad benchmarks.